
“People try to put us down …
Talkin bout my generation …
I hope I die before I get old … “
Social Generations
The Who‘s fans, singing along in 1965, mostly from the Baby Boomer generation.
Those Boomers are a social generation, a “birth cohort” of people in some region (e.g. The Western World) who are born into a social context that is relatively stable from birth through adolescence to early adulthood. Social generations share formative influences and/or critical events, so are defined by wars, pandemics, technology, and social or political change. The boomer generation started with a post-WW2 surge in the birth rate, from 1946. But how long this generation lasted is pretty arbitrary. The world changes quite fast. The Boomer generation is often said to have ended in 1964. That’s 18 years. Long enough for a few parents and their children to be in the “same” generation. So, that’s weird.
But how long is a family tree’s generation, on average? A genealogical one, from parent to child, etc. When we say such-and-such happened ten generations ago, do we mean 200 or 300 years? Are there five, four or even just three generations per century? Unsurprisingly, there’s no simple definition. But there are averages.
My family is, I think, extreme… Let’s see.
Two touches from the 1700s
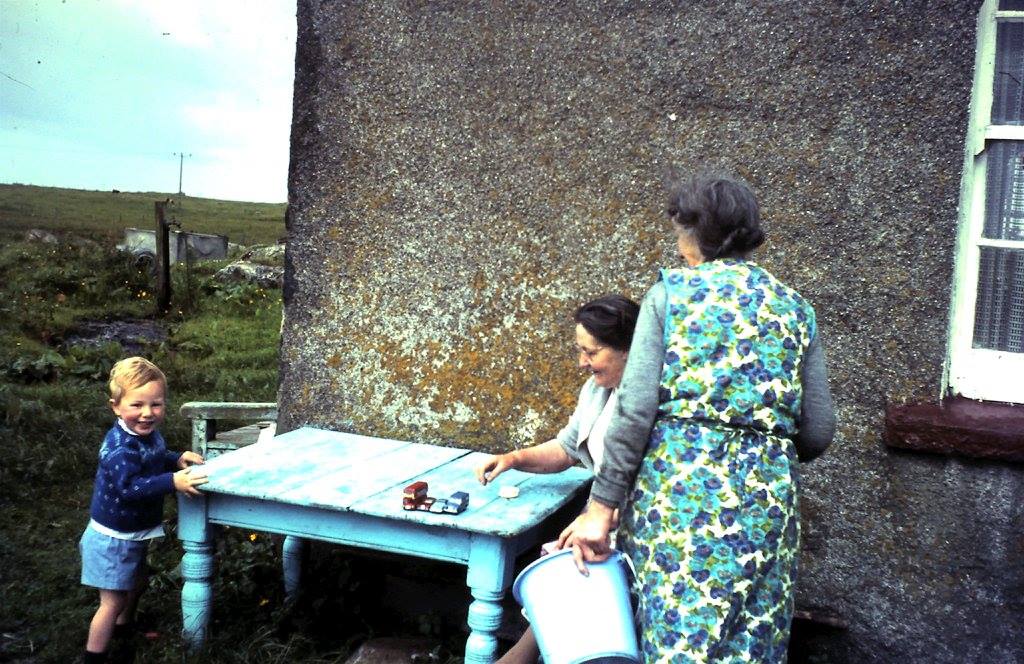
My octogenarian grandfather (Duncan Black 1886-1971, aka “Pop”) tickled me with his tobacco-stained moustache in the 1960s. Pop must have been held, likewise, by his own 88 year old grandfather (also Duncan Black 1798-1886).

So I feel the call of 1798, the year my great great grandfather was born. That’s four generations. Two whiskery kisses. Two old men sequentially holding a grandchild.
This link takes my imagination back into the 18th C., over 220 years ago. Horatio Nelson defeating the Napoleonic navy at the Battle of the Nile. Even two generations takes me to 1886, when Benz patented the first motorcar, Freud opened his clinic, and Stevenson published The Strange Case of Dr Jekyll and Mr Hyde.
But those four generations span 166 years, an average of 41 years each. Facts can be full of romance. And those 166 years are not all down the male line, either (actually, from birth to birth: 52m, 36m, 36m, 42f years).
But surely a sequence of 41 year long generations (on average) is weird? I reckon so! But after all, it’s just one line up my tree. It’s not typical, because I chose an extreme example.
Though not the most extreme. The paternal grandfather of my granny from Lismore (Euphemia Mackinnon 1895-1973, from Benbecula originally), was called Donald MacKinnon. He was born around 1791, and from birth to birth the generations run ~49m, ~50m, 27f, 42f over those ~173 years.
Familial Generations
In genealogy, we are interested in the who’s who of familial generations. People who lie in the same layer in a family tree, as defined by the logic of ancestry and descendancy. A familial generation typically spans more than one social one, because siblings, cousins, and so on cannot all be the same age. Some are always older, and some are younger.
How old are the cousins?
A generation has an average date (mean or median) based on the span of years of birth from its oldest to its youngest members. How wide is the range of ages? Who is the youngest cousin? The oldest sibling?
People have nieces or nephews older than themselves. Cousins older than their parents. Things get out of step quite quickly.
We are each born in a specific year. If we have siblings, the range of years for our co-generation sibings is of course wider. If we extend our view out from self to siblings to cousins, while sticking in the same generation, the range of birth years will grow. The link between familial and social generations weakens.
So, familial generations get smeared in time, quite unlike the social ones. The further back you go, the greater the smearing, and the less chance there is that all those cousins had a common experience. The eldest could have been a prim Edwardian, and the youngest… screaming at The Who.
Whatever the age range is for siblings, it cannot shrink when first cousins are added to the mix, and is likely to get bigger. The range of birth years is greater yet when this core familial generation is augmented with second cousins, and so on.
The range of birth years will be wider still when the partners of these blood relations are included. And their siblings. After all, your youngest cousin has a 50/50 chance of having a younger spouse. The eldest sibling tends to start their family first, generating the oldest cousins.
Old fathers
And there are those old fathers. Male humans can breed into their dotage, if circumstances like wealth or power let them attract fertile female partners, or if female consent is not even an issue.
It gets creepy.
Think (if you dare) about the gruesome Bernie Ecclestone, a father again in 2020 at the age of 89 to Ace Ecclestone. That infant’s siblings include Tamara (aged 36) and Deborah (aged 65). That’s a two-generational smear! (I wonder what prompted ~36 year old Fabiana Flosi to marry the ~81 year old billionaire in 2012?)
Old husbands
Ecclestone’s story is an extreme example of a cliché for the rich and famous, but in fact, many of our ordinary male ancestors remarried after their earlier wives had died of exhaustion, disease, or in childbirth… and they went on to have yet more children as old men.
Others were married late in life to a young woman, whose role was surely not as an adult equal.
I believe, for example, that my most “ancient” close relative just two generations back was not Pop, pictured above, but an in-law, my great uncle John Logan, who was born in January 1860. That’s more than 100 years before me. His wife Mabel was my paternal grandfather’s eldest sister.
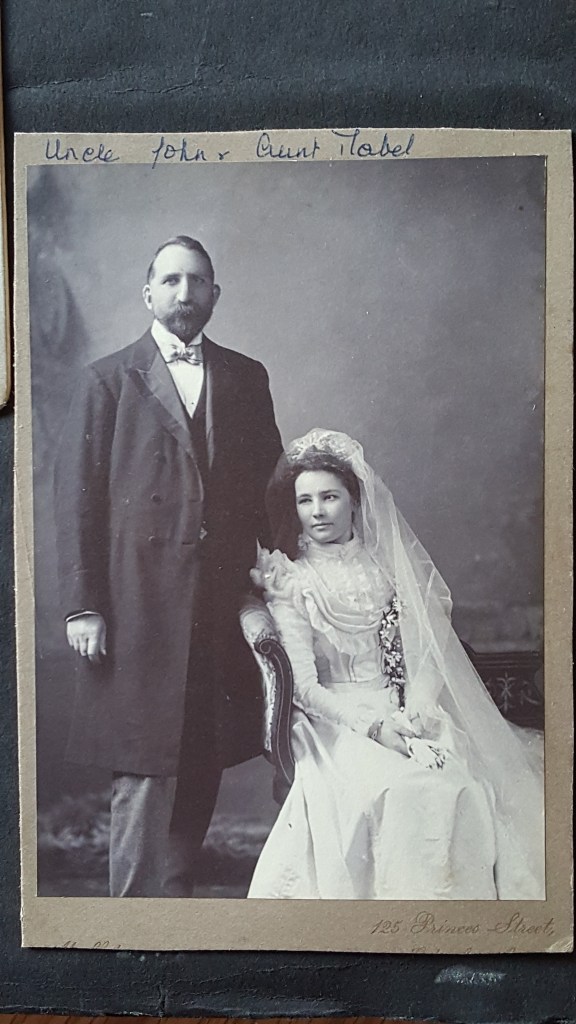
John was 38 when he married Mabel, on the day after her 19th birthday. A big gap. And 19 was a woefully young age for a person to make such a big decision, in my opinion, if she even really did. He was a business partner of some kind of her father’s. John Logan died in 1933, at the ripe old age of 79, while my grannie, in the same generation from my perspective, died in 1973 at the age of 78.
I am, happily, in contact by email with a 2nd cousin who is descended from Mabel and John. He is over eighty now. We are one and maybe two social generations apart, even though we are in the same familial generation. The difference in years could be easily described as being one generation.
Mabel’s younger sister Ebeth (Elizabeth Forrester Scobbie, 10/4/1884-19/11/1940) was a bit different. She was widowed young, and remarried in later life (6/8/1930), to an older widower (with a bigger age gap), Robert Galloway (2/2/1861-30/12/1936), a mid-Victorian whose birth was almost as early as John Logan’s. Ebeth’s story is told elsewhere, e.g. here, Robert’s here, and their marriage here. (See Entry #1 under Storyshelf for an overview.
So it goes. A marriage can stretch the range of a familial generation even further.
My familial generation (blood relatives)
- My siblings and me: a 17 year range
- My first cousins, my siblings & me: a 27 year range, median birth year 1952, based on a complete set of 21 people.
- the maternal side: a 20 year range, median birth year 1954
- the paternal side: a 24 year range, median birth year 1947
- Known second cousins in 2020: a 34 year range, median birth year 1954, based on a very incomplete set of 30 people.
My information is skewed to my father’s side, which is older. The list of 2nd cousins on that side is almost complete, I think. However, I am missing many people’s existence (let alone names and dates) on my mother’s side, particularly the 2nd cousins who are descended from the six elder siblings of my maternal grandmother Euphemia MacKinnon, herself born in Balivanich Benbecula on 25 February 1895. So I suspect these figures underestimate the range.
Ancestral generations
A narrower perspective that is easier to compute (and which is likely to be based on complete data) can be achieved when you zoom in to consider just your own direct ancestors.
What’s the gap between your birth and the average of the births of your parents? How long is that generation? And up the tree, what is the average generation gap? How does it vary as the years pass?
20, 25 or 33 years?
The question I first thought I was asking here was: “How long is a generation?” I can refine this a bit now, to: “How long are your ancestral generations?”

Most likely yours’ll be near the average length for your year of birth for a western upbringing, if, like me, that’s your background. Of course, your generations might be consistently short, if your ancestors were repeatedly the earliest children of young (e.g. teenage) parents. Maybe, however, like me, you suspect you have unusually long generations.
So, how long are yours? Do you have five, four, or three generations per century? Even more? Or fewer? My 41 year generation mentioned above seems exceptional. So let’s get a more representative measure, based on everyone, not based on the oldest line.
A challenge
In my tree, so many of my ancestors were old parents that my average generations are, I think, longer than most people’s. In fact, I wonder if anyone at all who reads this will have a longer gap than me from their own birth to the average birth year of their great grandparents or great great grandparents? There’s a challenge!
Me, I’ve got fewer than three generations per century.
| Years | P | GP | Gr GP | Gr Gr GP |
| Mean birth | 1921 | 1886 | 1851 | 1814 |
| Median birth | 1921 | 1884 | 1852 | 1818 |
| Earliest birth | 1920 | 1881 | 1839 | 1791 |
| Range | 2 | 14 | 19 | 40 |
| Gen (mean) | 43 | 35 | 35 | 37 |
| Gen (median) | 43 | 37 | 32 | 34 |
I have an exact or likely year of birth of only 15 of my 16 great great grandparents, so I will be approximate rather than absolute in my calculations. Also, I have ignored the exactitude that months and days brings.
So, the time depth between my birth year and the mean birth year of my great great grand parents, four generations back, is about 150 years, or an average of 37.5 years per generation. Only two and half generations per century. It’s slightly less if we use the median (around 35.5 years) or the mean of means (37.3).
1964-1814 = 150 and 150/4=37.5 and 100/37.5= 2 and two third generations per century.
The data is pretty complete. New information will, I think, only increase the gap.
So… can you beat that?
NOTES
Wikipedia, as usual, has a good post on social generations. It’s currently a section in “Generations” – a List of Named Generations. Also as usual, it lacks critical analysis of the concepts. There is a lack of overlap between generations; there is a desire to give them all the same duration around 15-17 years; it is focused on high income nations and regions in global cultural terms ; there is only one, complete, list; sounds superficially like a respected sociological tool; is a primitive marketing tool that assumes broad shared experience and age are useful for directing advertising efficiently to an audience, ignoring class, gender, ethnicity, occupation and location. The concept seems so crude and pre-Social-Media, ad the specific generation so rigid and inaccurate… but there is an ongoing appeal.
Thanks to Kirsty for prompting me to consider social and genealogical generations together – it has been food for thought.
A surprisingly amateurish and unauthoritative ramble on the concept of the generation gap can be found in Wikipedia, at https://en.wikipedia.org/wiki/Generation_gap
On the other hand, here is a review by Donn Devine (2016) which reports research and evidence in favour of assuming a rounded 3 generations per century for men, and three and a half for women – which is important for estimating the time-depth of common ancestors on the basis of DNA.
I thoroughly recommend a visit to the Isle of Lismore, a short trip from Oban or Port Appin. See the viking Castle Coeffin, Moluag’s cathedral (the true home of christianity in Scotland… not Iona!), the broch, and the fantastic Heritage Centre, also on Facebook. Pop is pictured there, along with many other Liosachs.
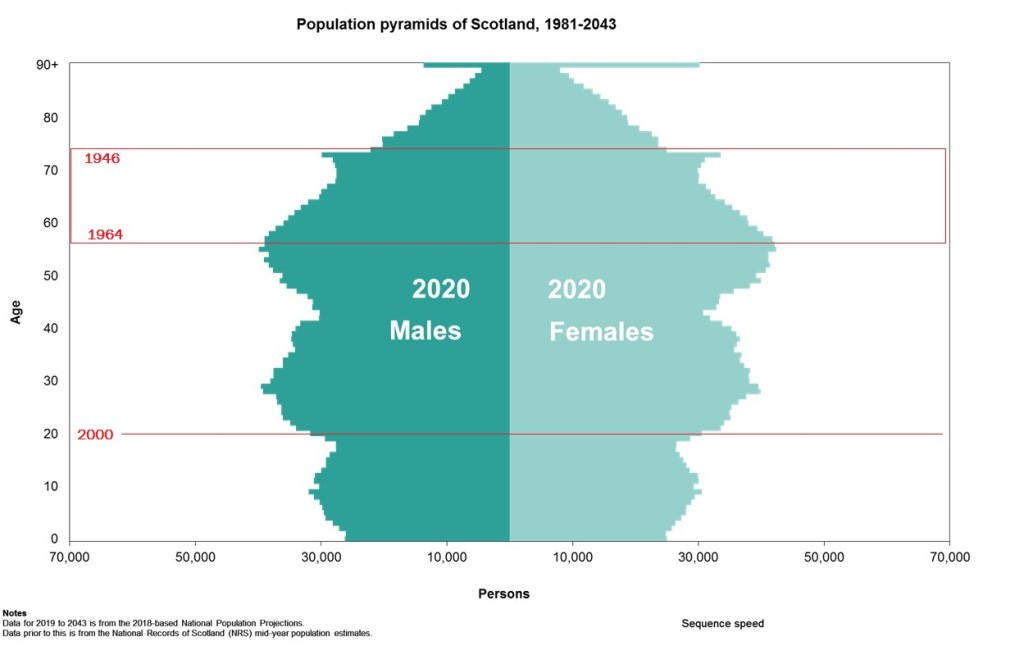
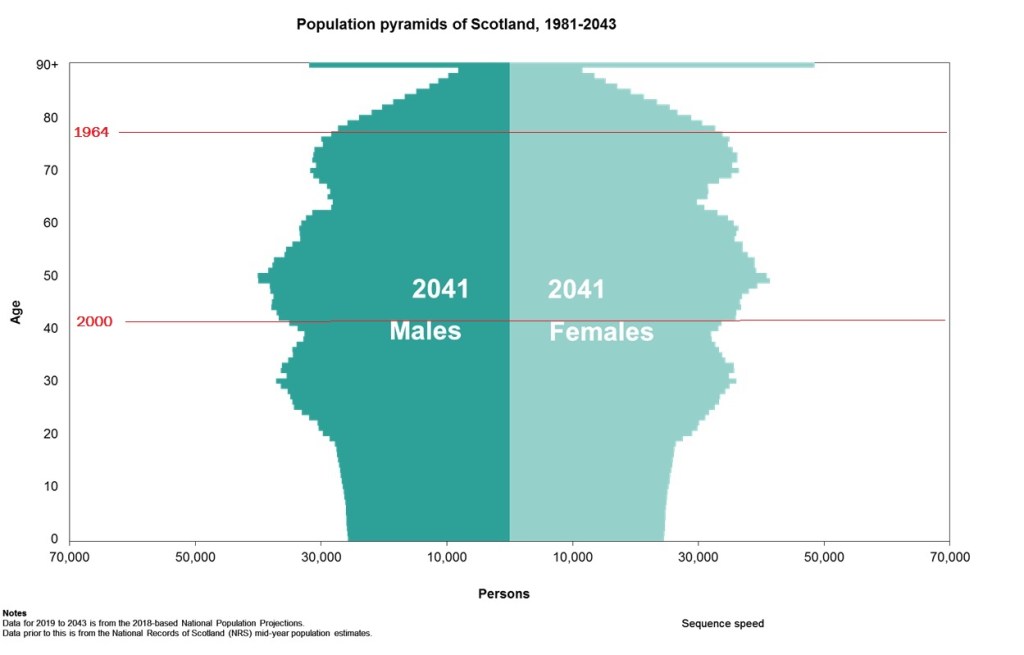
The National Records of Scotland have a number of interesting and accessible statistical reports. I don’t think they have an analysis of generations, however. Their population records (and estimates) for example by year show what a misnomer “Baby Boomer” is, when applied from 1946 to 1964 as a “generation”. Perhaps we should use the rather rude “Me Generation”? Or just acknowledge there was only a short sharp spike in the birth rate near the beginning of the period (1947, in Scotland), building up to another peak in 1965.

Sources
The picture of The Who in 1965 was from an article in The Telegraph https://www.telegraph.co.uk/culture/glastonbury/11698801/the-who-in-pictures.html and is credited “Picture: REX”.
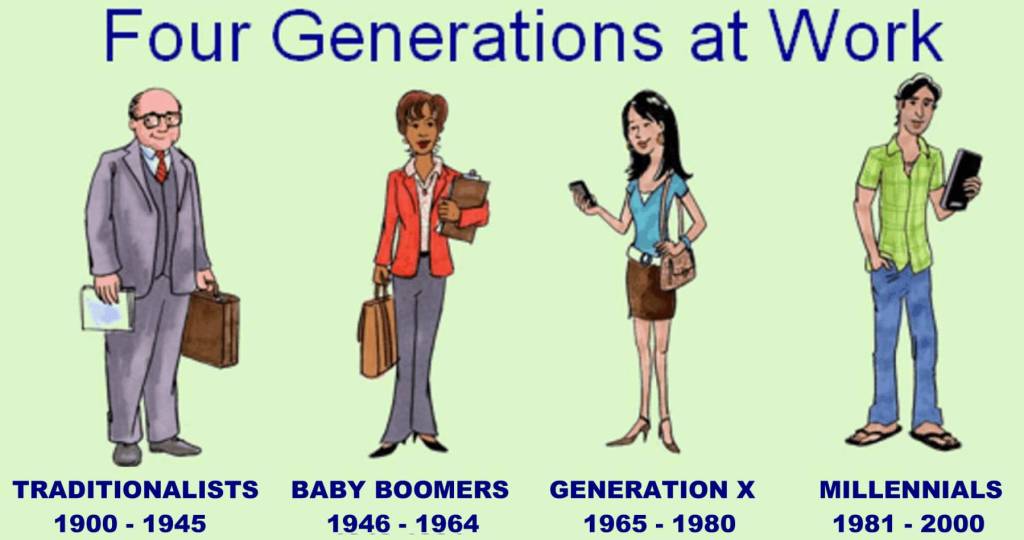
Four Generations at Work is an image from a blog by Dinos Storage – Winnipeg Canada “Where your stuff’s in the doghouse, so you’re not!” who have a 2015 blog (Aug 9) that expresses the social stereotypes in Canada (or North America more generally) rather nicely. I recommend it. The author Lena Erickson added another on the Silent Generation (b. 1928-1945) in a 2018 post.
The population pyramids are adapted from charts (c) Crown Copyright 21 October 2019, downloaded from National Records of Scotland at https://www.nrscotland.gov.uk/statistics-and-data/statistics/statistics-by-theme/population/population-projections/population-projections-scotland/population-pyramids-of-scotland
I probably ought to find a non-copyright “mind the gap” image, or take one myself. I’ll replace the current one if the copyright holder objects. There are lots of nice free-to-use “generation gap” images and cartoons: https://www.ecosia.org/images?q=generation+gap&license=share
